.png)
Is home team advantage really reduced for fan-less games?
- Pedro Ferreira

- Jan 3, 2022
- 2 min read
An example of how statistics can help us on better understanding results
"In God we trust, all others must bring data" - W. Edwards Deming
Summary:
A hypothesis test was performed to analyze the correlation between classificatory variables. Results from the Brazilian National Soccer Championship were compared for seasons 2019 (with supporters) and 2020 (fan-less) up to September 8th to check if, statistically, the home team advantage has changed.
Conclusion: one cannot state so far, by observing all the clubs results together that fan-less games are different from games with attendance, in regards to home team advantage.
By using a basic statistical test, we can avoid precipitated conclusions. The reason why we use these approaches in continuous improvement projects.
A famous Brazilian sports journalist mentioned in September, 2020 on the radio that, according to the last round of the national soccer championship, fan-less games had clearly eliminated the historic advantage of home squads. Either soccer and/or Lean Six Sigma methodology fans should not let such an opportunity to check if his intuition (and, by the way, of many other sports analysts) was right. As we know, humans can’t properly deal with variation merely using intuition.
We are, therefore, facing a Hypothesis Test in which we start from the assumption of no difference between having attendance or not , and we will test the likelihood of this condition being special, in other words, that the absence of supporters changes the proportion of home team’s victories.
Let’s assume, for this analysis, data from the previous and current season games up to September 8th, 2020 since fan-less games were being held that year. This was our setup:
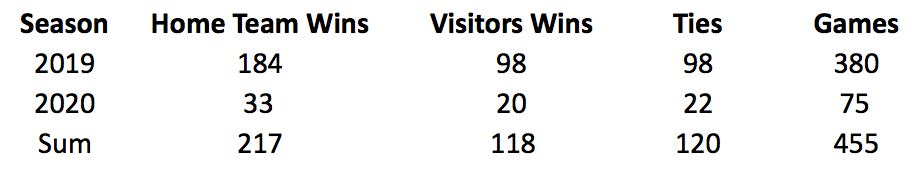
Can we already point out any conclusion?
As we are dealing with comparison of classificatory data (season vs. results), the most suitable statistical tool is Chi-Square Test, which is based on observed (what we actually measured) and expected (predicted) counts.
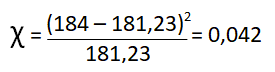
For this test, the expected count is the one that makes the same proportion for the seasons (rows) and results (columns). In other words, if there is no difference between the seasons, the proportion of results should be the same. For example, the expected count of home team wins in 2019 should be:

The contribution of this value to Chi-Square statistics gives us a dimension of how relevant this difference is:
The statistical relevance of this value can be obtained from Pearson Chi-Square statistic determination (the sum of each individual contribution) and the specific distribution table (or from a software such as Excel or Minitab). Let’s move directly to overall results:
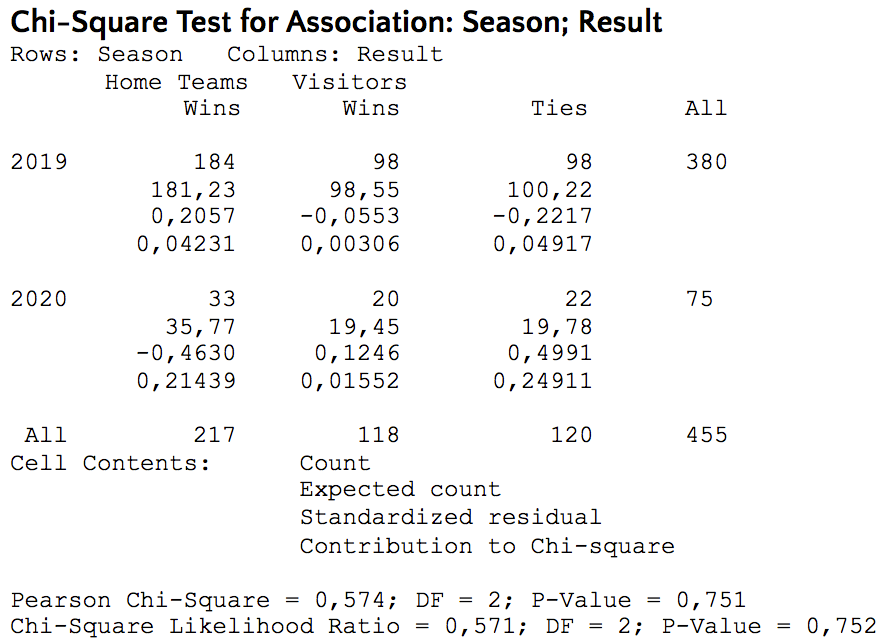
Conclusion:
Due to small differences between the observed vs. expected counts, small values for individual contribution and overall statistics, specially P-Value (which can be better addressed in further texts), one cannot definitely state so far, by observing all the clubs results together that fan-less games are different from games with attendance, on regards of home team advantage.
It seems that this journalist's intuition was apparently mistaken.


Comments